A little foray into the virtual cell challenge.
The virtual cell challenge is a brand new challenge released by the Arc Institute to help progress single cell predictions against perturbations. This research is crucial into our understanding of how cells behave under perturbations and allows us to create novel cells. It comes alongside their own release of State, a model to do just this.
Understanding, predicting, and ultimately programming how cells respond to internal cues and external stimuli is a fundamental challenge in biology.
From The data is split into 3. Training with 150 perturbations, Validation set with 50 perturbations and the final test set with 50 perturbations.
Timeline
The absence to the
The PDS spiral
Perturbation Discrimination Score is one of the core evaluation metrics and as it turns out, became almost the sole decider of the whole competition. This was due to a few factors.
Scoring is skewed towards PDS
The 3 evaluation metrics are Mean Absolute Error, Differential Expression Score (DES) and Perturbation Discrimination Score (PDS)
Metrics are measured based on baseline value. The baselines are created using the aggregate cell-mean change. The baseline ended up being 0.027 for MAE, 0.106 for DES and 0.514 for PDS.
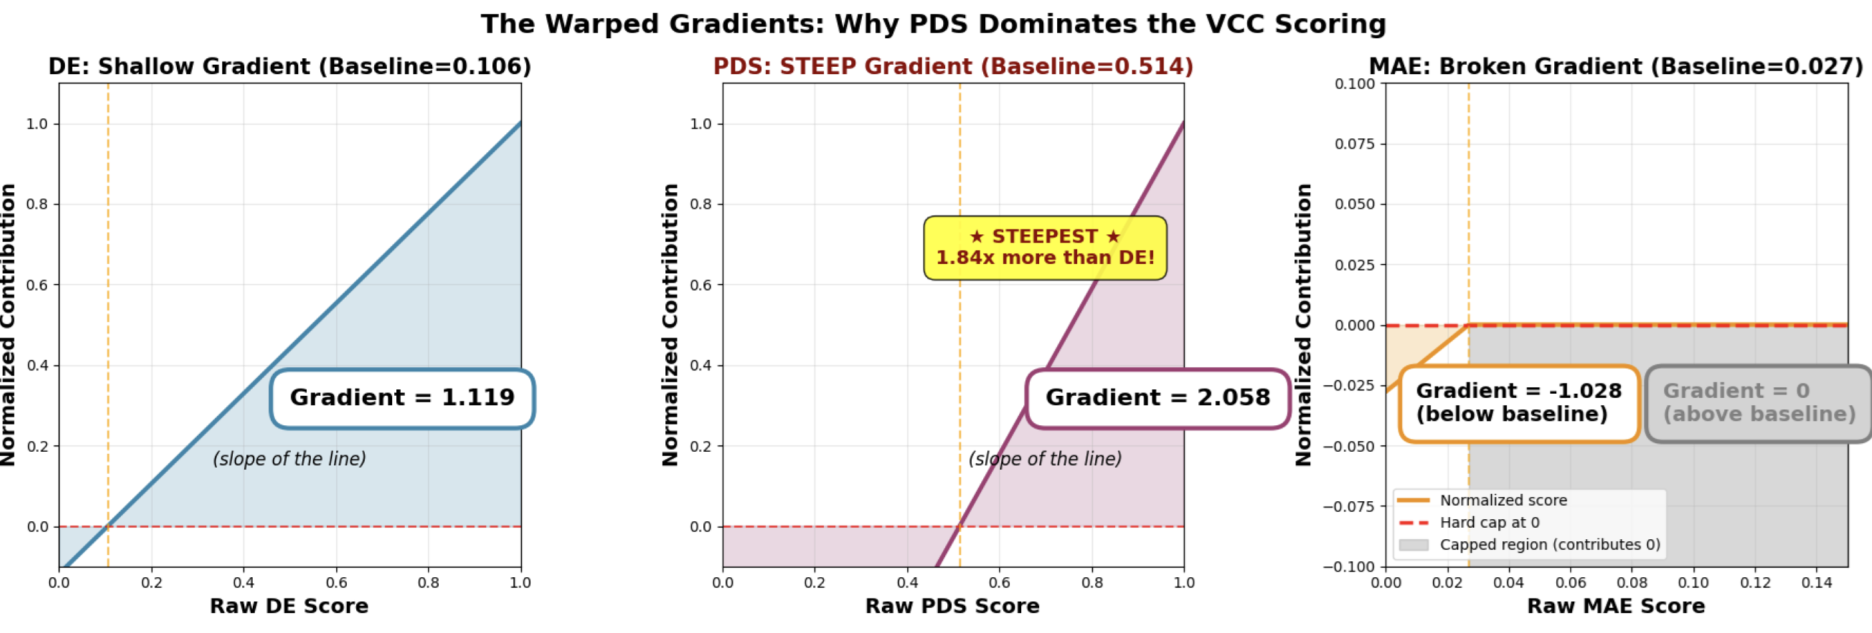 Because DES and PDS are then scaled so that 1 is perfect while MAE is scaled so that 0 is perfect. This meant the gradient of the points value is vastly different. A single point increase in PDS amounts to much more than either DES or MAE. The added fact that any score under the baseline is cropped to zero, it meant MAE is almost useless (regardless of what the organisers are trying to convince us).
 We made a design choice this year not to penalize models that perform worse than the baseline on any one metric because they may still outperform on other metrics. We understand there is a downside to this approach: as the current leaderboard shows, some top-performing models are not doing well at all on MAE. But that does not mean MAE can’t be a differentiating factor, if some Challengers find a way to do better on that metric. https://discord.com/channels/1385383995704999947/1423038641764175882/1423746443583291516
Note PDS also already caused headache in the middle-end stage of the competition where a small code inaccuracy of an misused abs operator caused the metric to consider only absolute sizes of differences and not the direction. This was correctly changed by the organiser. https://discord.com/channels/1385383995704999947/1387880200880132359/1423037528046440652
Pseudo-bulking
PDS is calculated on the pseudo-bulk level. This means that all submitted cells of the same cell lines are grouped and average before it goes into the PDS calculation. This in turn makes the single-cell nature of the expression profiles a distraction for this metric. DES does look at single cell, but
Gaming the leaderboard
The validation and test set’s non-targeting cells are not released.
My small attempt
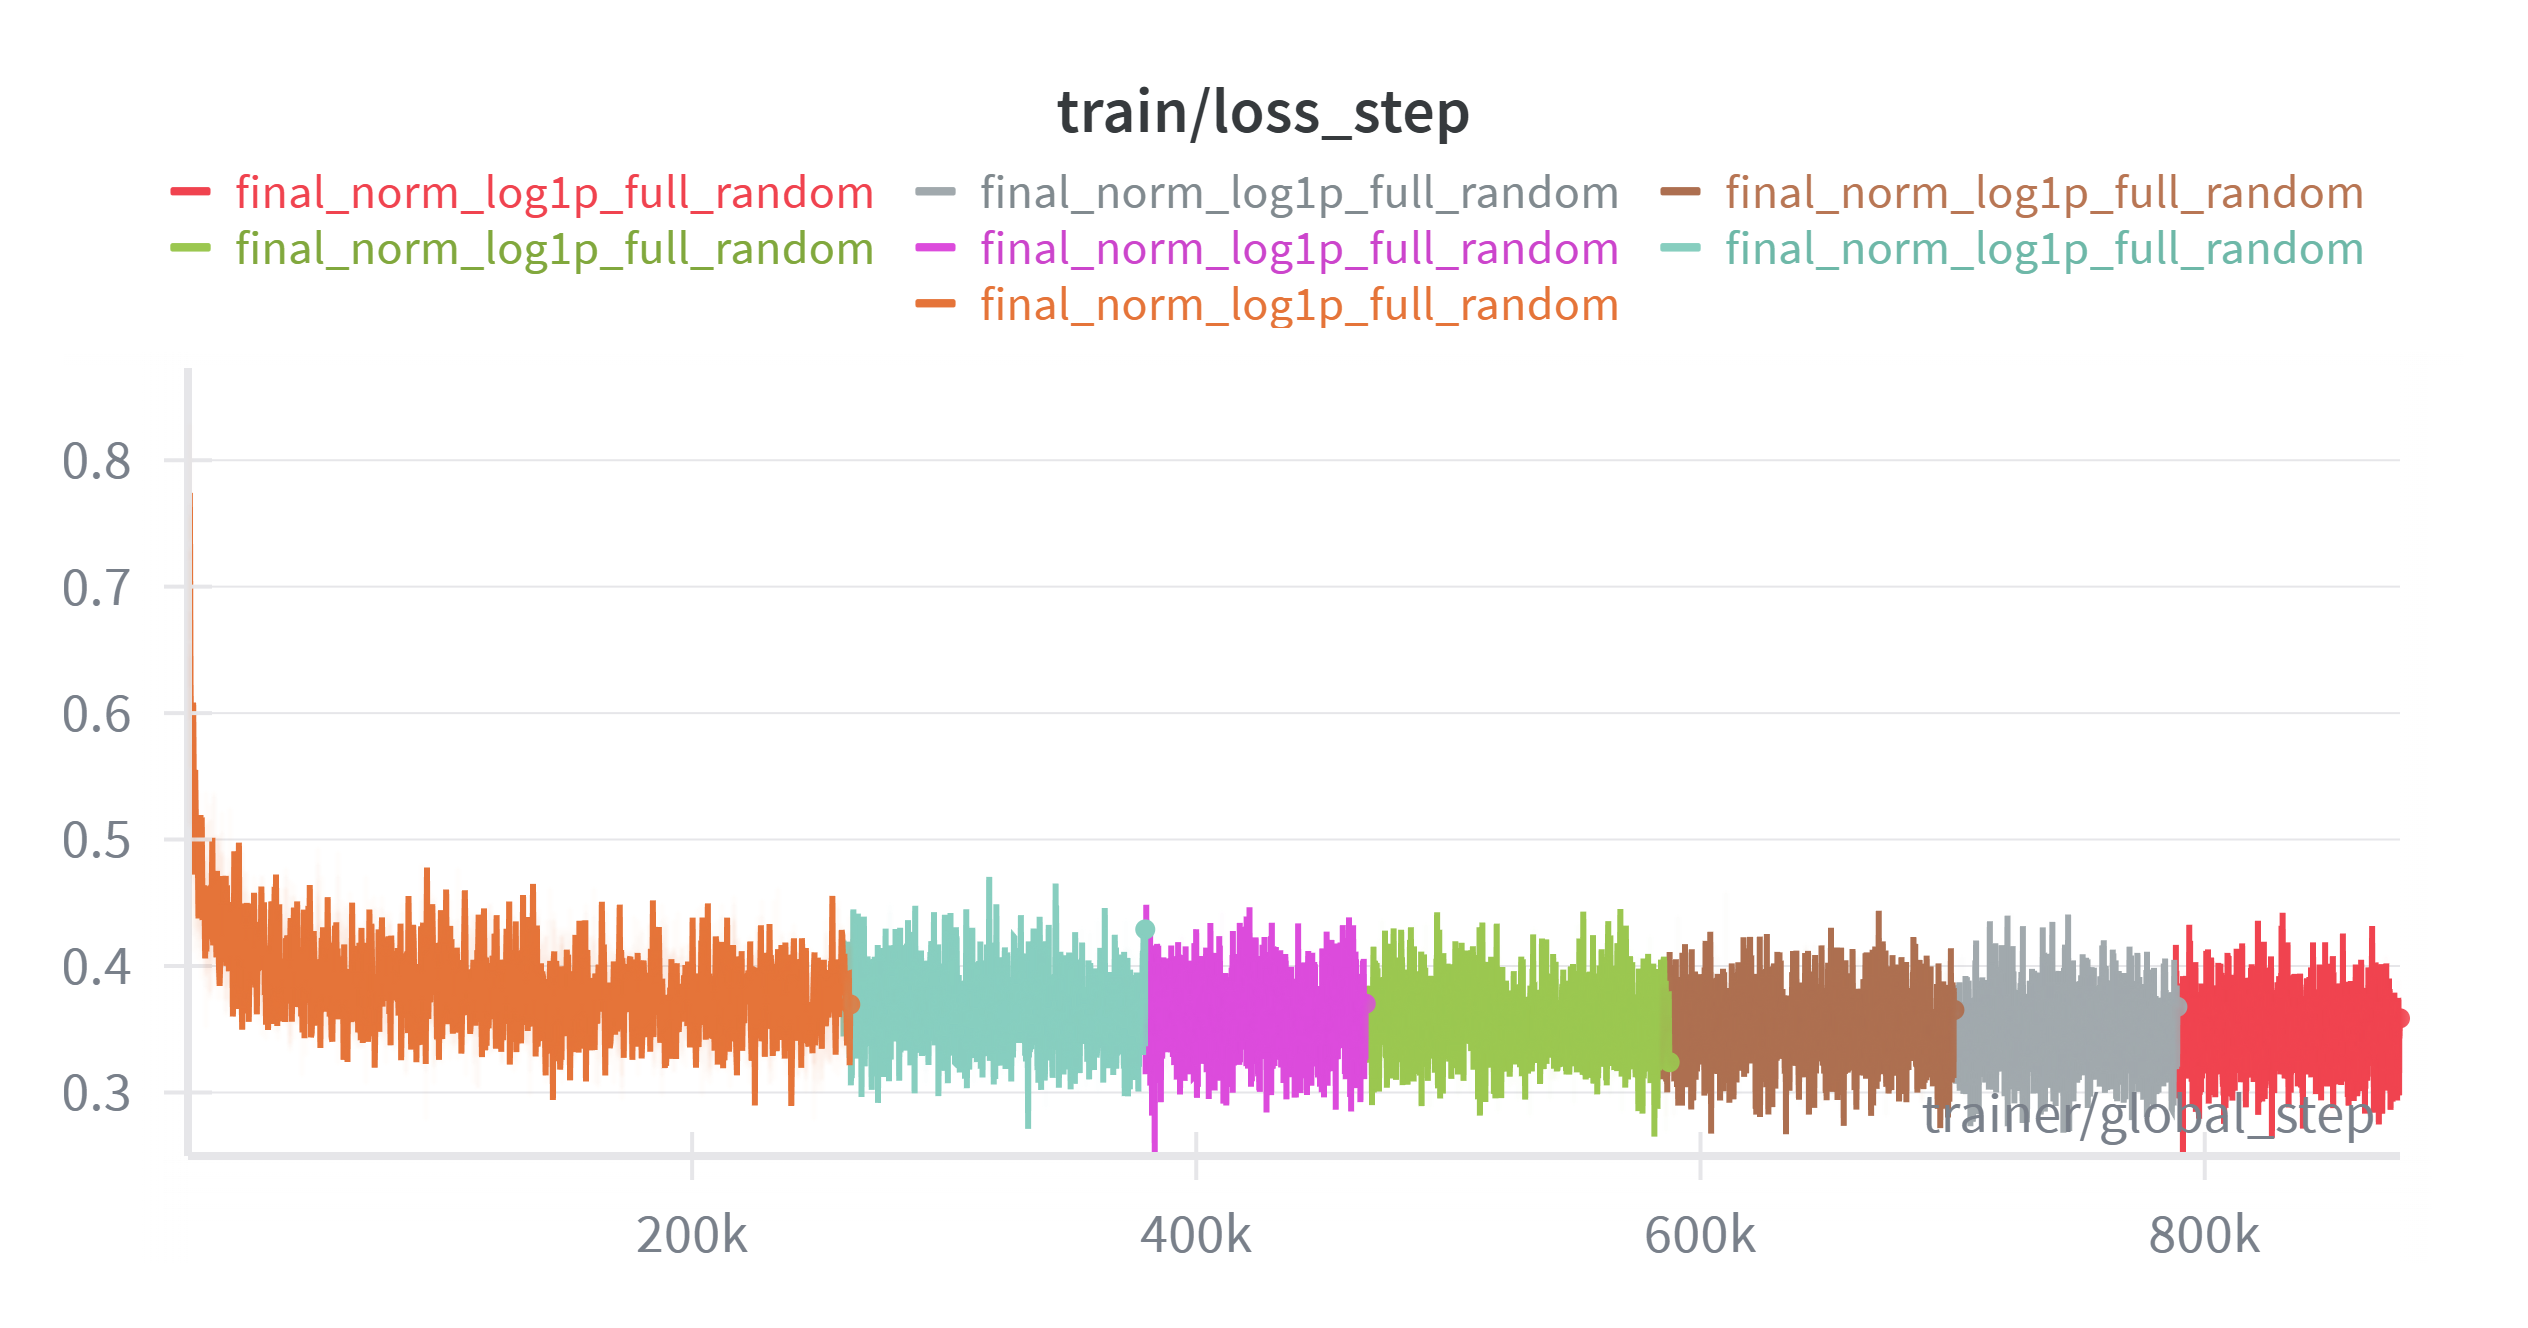
My attempt is to leverage a simple encoder-only transformer based on the following:
Measured Gene ESM embedding + Perturbed Gene ESM embedding + Original control value random => Predicted value
I never managed to get a proper validation workflow working with the validation set (which is a persistent problem amongst other participants as the control cells are different in the test sets). Hence as I was running out of time, I ended up only training via the loss function.
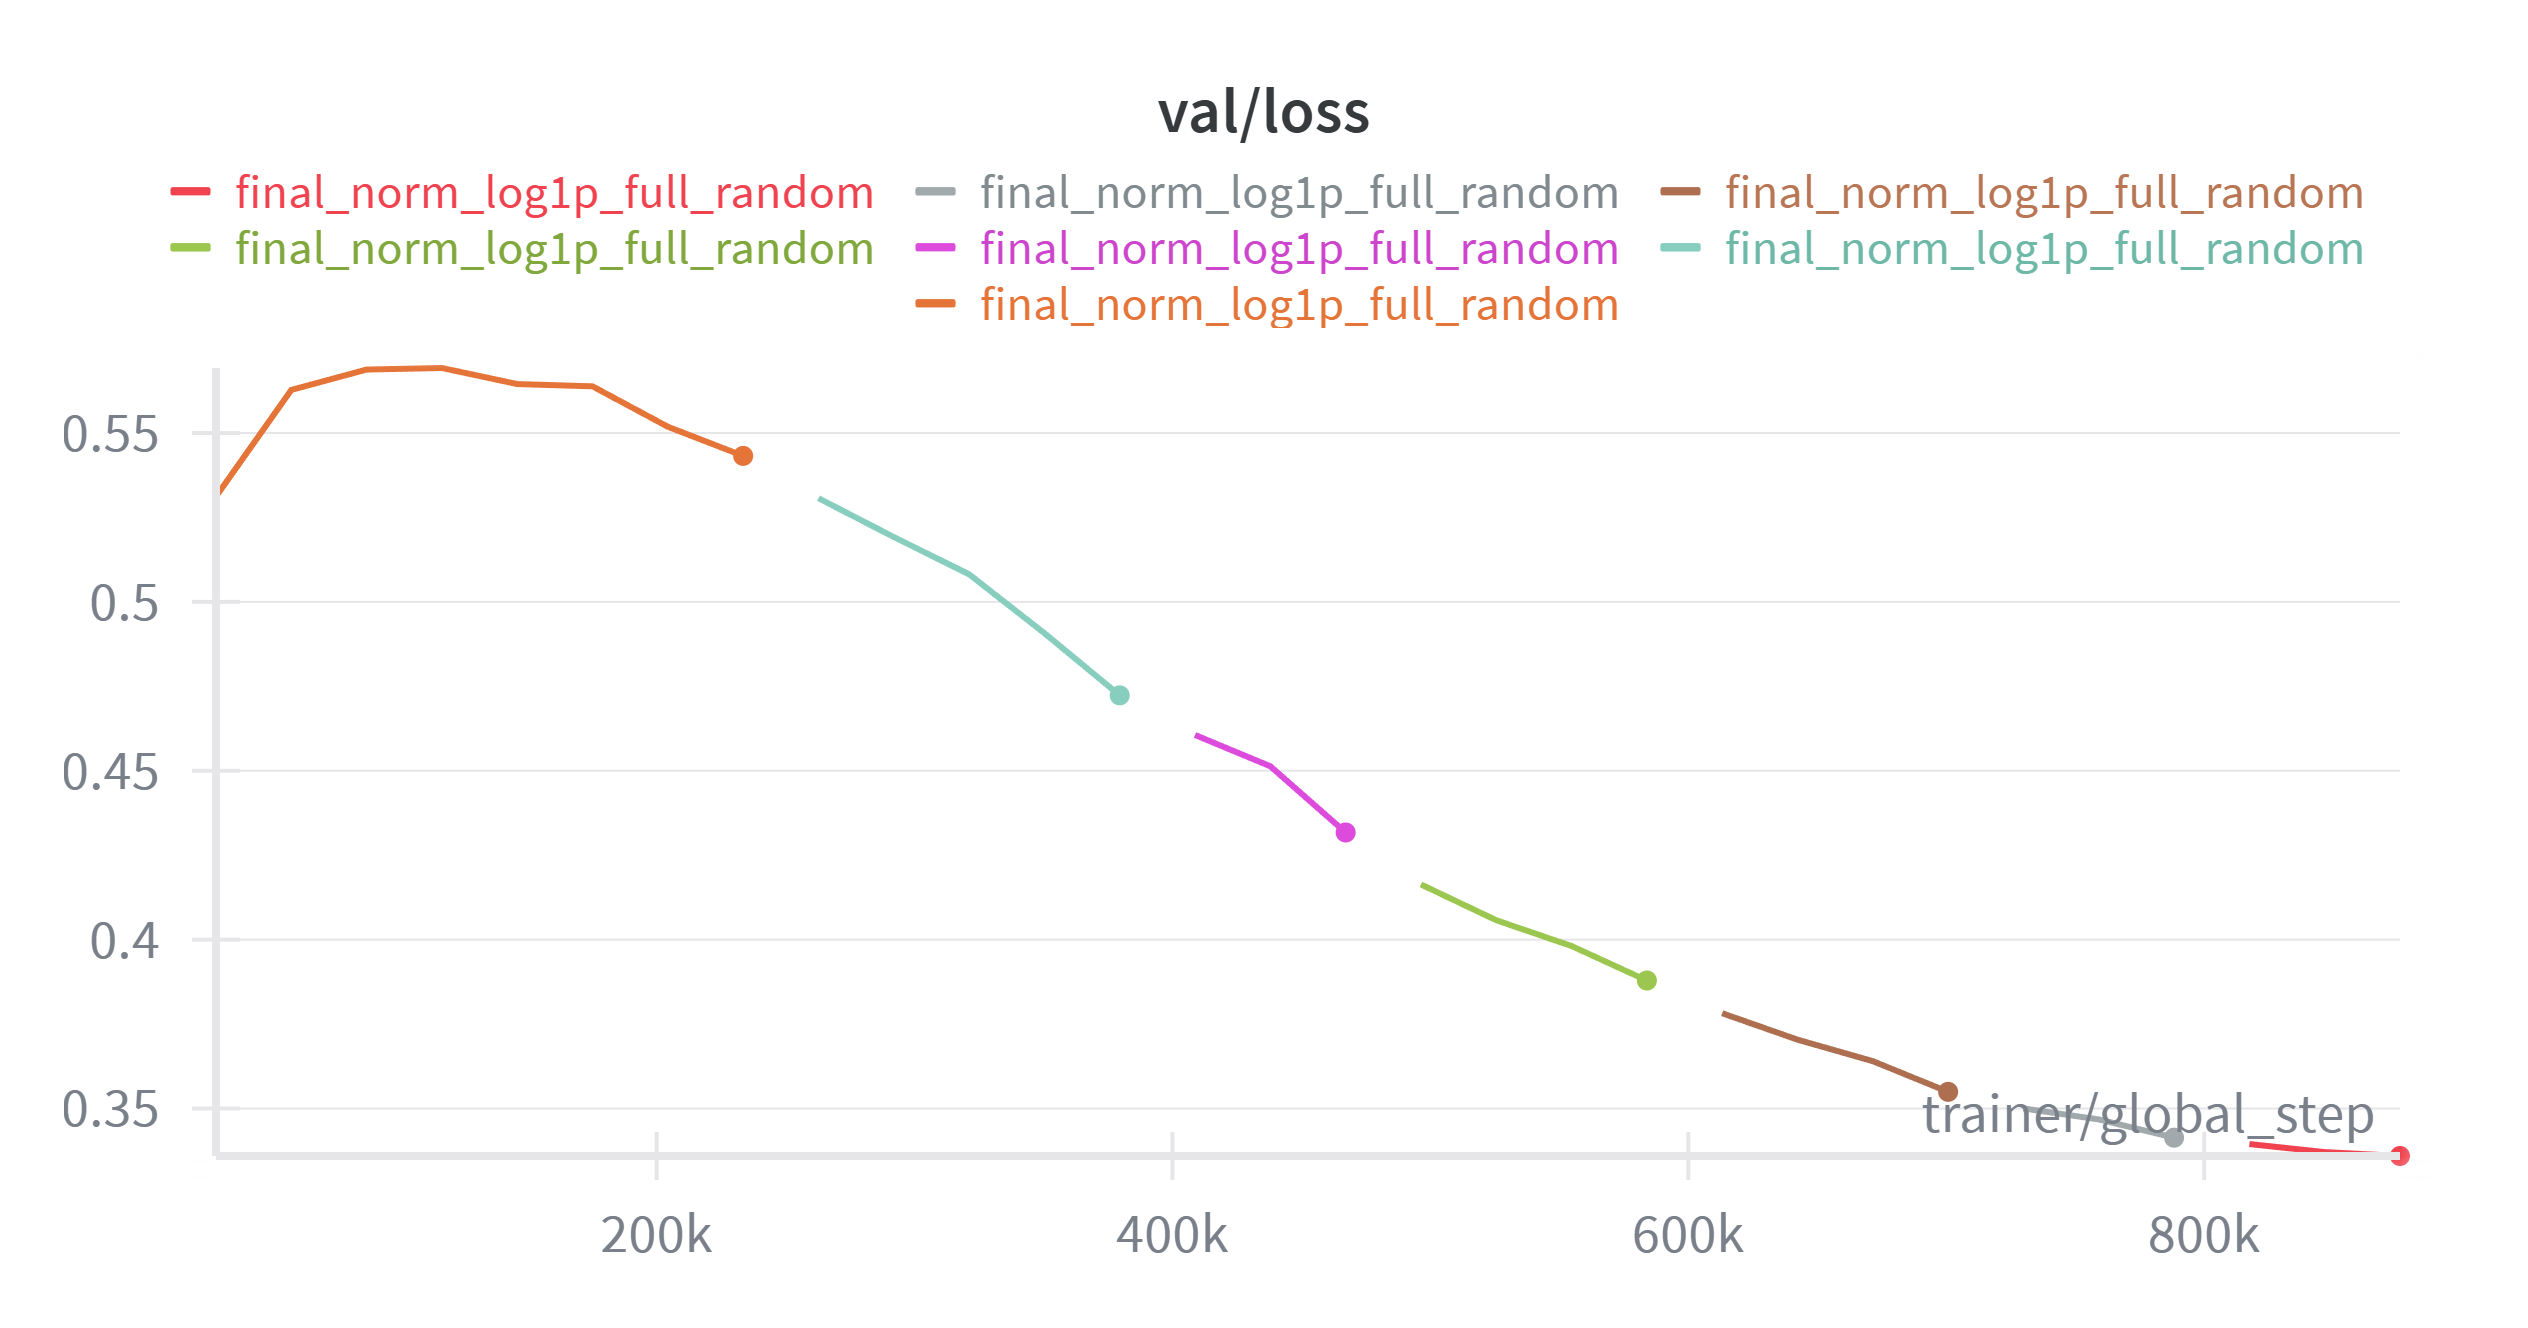
On inference, I also pick random control cells from the original set. The charts look nice but the performance was not!